 Danielle Teychenne
Since the beginning of Covid-19, high numbers of city dwelling families have moved to urban and peri-urban areas, with little to no knowledge of the landscape and its bushfire risk. We targeted these unaware and inexperienced populations.
With innovations in tech, personalised education is becoming the norm, and even expected from learners in 2022. With all the distractions of life (e.g work, kids, Netflix), it’s hard to get bushfire prone residents to write their bushfire plan, let alone act upon it.
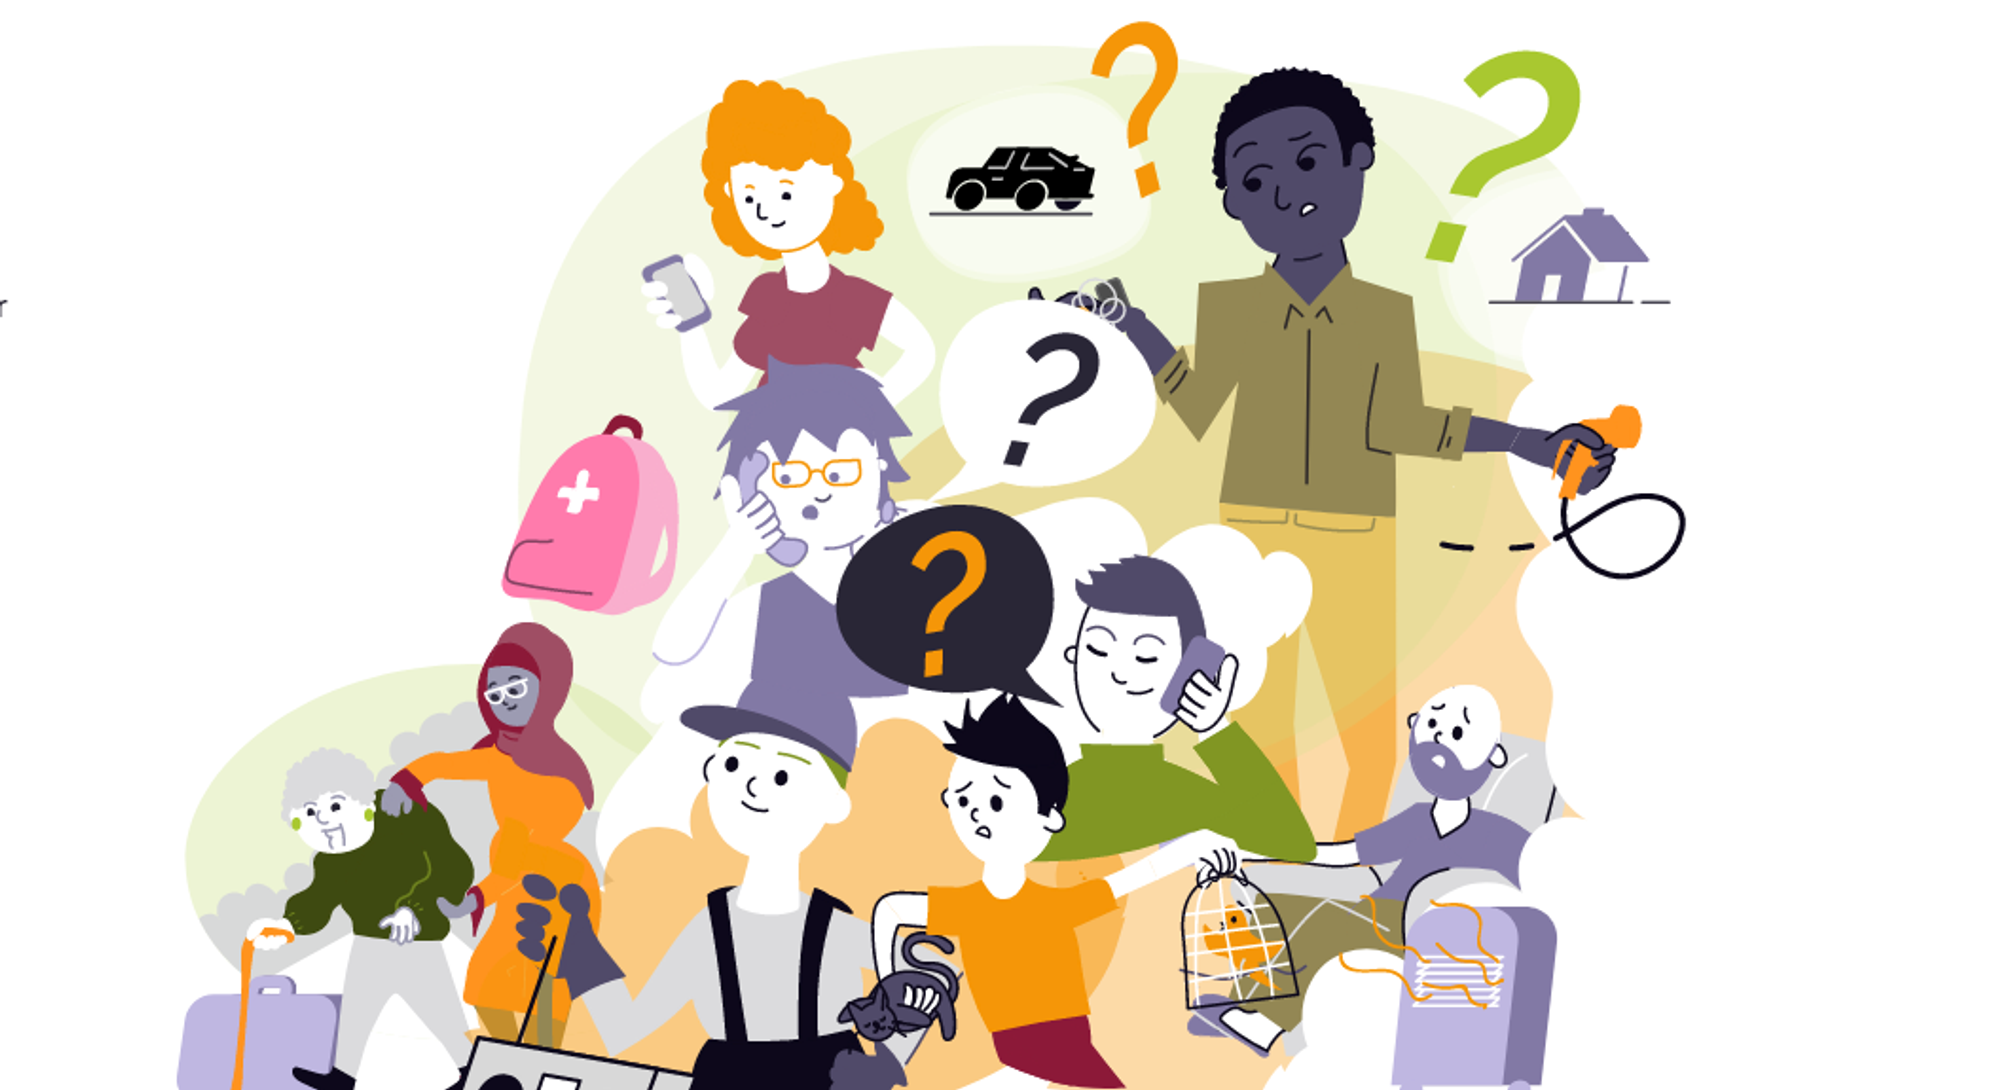
That’s why ClimateThrive have created tailored behaviour change journeys for different groups of the population based on their beliefs, perceptions and experience with bushfire.
These groups are based on Dr Strahan et al.’s (2018) bushfire archetypes and determine an individual’s beliefs, values and attitudes towards bushfires.

To ensure that we cut through the noise of everyday life, we’ve kept each journey bite sized and email based for convenience.
After extensive behavioural mapping and blueprinting, we’ve been able to see which small, achievable steps (or ‘breadcrumbs’, as we call them) should be chosen and in what order to achieve gradual change in bushfire preparedness.
For instance, a Considered Evacuator archetype often has high ambitions of accomplishing several tasks before their evacuation. However, their long lists of to-dos may inadvertently cause them to delay.
To counter this the first step on their behavioural journey is to stock taking how long each preparedness activity takes, prioritising them for different types of scenarios (e.g their pet goes missing). After a bushfire evacuation rehearsal they can time their preparedness activities and adjust for future.
We’ve used the latest research from behavioural science, including nudge theory, mental models and user experience design. We’re even doing simple A/B testing, like sending out emails on warmer days to elicit more changes in behaviour.
Digital divides
As with any intervention, there’s no one-size-fits-all approach and certainly never 100% success. ClimateThrive recognises that some bushfire prone residents may either have low English literacy, digital literacy and/or internet connectivity.
Continual improvement
We are constantly collecting analytics and user testing data in order to make further improvements. We’re using products such as Tableau and Google Analytics to track and measure user engagement across each journey.
You can read more about our partnership in our case study here.

